> ## Documentation Index
> Fetch the complete documentation index at: https://docs.askfutures.com/llms.txt
> Use this file to discover all available pages before exploring further.
# Optimize a strategy
> Sweep a parameter by chatting or in the on-card panel, pick the metric, read the dot chart or parametric heatmap, and save the best combination as a new version.
You can optimize a strategy two ways: by **chatting** — *"sweep the stop between
10 and 50 points"* — or directly on the strategy card in the **Optimization
Parameters** panel, where you set a from/to/by range for each parameter and watch
a live count of how many combinations you're about to run. Either way, AskFutures
runs a backtest for every value in the range, ranks them by the metric you care
about, and shows you which combination scored best. You then select the winner to
save it as a new version.
Every run in a sweep is a normal, deterministic backtest — same real prices,
same modeled costs. Optimization just runs many of them and compares the
numbers. The AI doesn't decide what's "best"; the simulator does the math and
the metric does the ranking. See [optimization](/concepts/optimization).
## Before you sweep
Optimize a strategy that **already backtests cleanly** and shows a plausible
edge — to refine it, not to rescue it. If the strategy fails to run, takes a
handful of trades, or loses across the board, no range of stop sizes will fix it.
Fix the logic in chat first (see [iterate and refine](/guides/iterate-and-refine)),
then sweep.
## Run a sweep by chatting
Name a tunable number on the strategy card and give it a range. Plain English
is enough:
* *"Optimize the stop between 10 and 50 points."*
* *"Sweep the EMA period from 10 to 50, step 5."*
* *"Try targets from $200 to $600 in \$100 steps."*
If you don't give a step, AskFutures picks a sensible number of evenly spaced
test points and tells you how many runs that is.
Tell it what "better" means for this idea — *"rank by average P\&L per trade,"*
*"best total P\&L,"* or *"best win rate."* If you don't say, AskFutures will
confirm the metric before it runs.
The strategy card shows the job before you commit — something like
*"1 parameter · 9 runs."* Two ranges multiply: a 5-value stop sweep crossed
with a 4-value target sweep is 20 runs. When it looks right, let it run.
AskFutures backtests every combination, ranks them by your metric, and reports
the winning parameter set. Like the look of one? Click **Select** on that row
(or just ask) — the chosen values become a new saved
[version](/concepts/sessions-versions-artifacts) of the strategy.
 ## Sweep one parameter or two
*"Sweep the stop from 10 to 50 points in steps of 5."*
AskFutures runs nine backtests — one per stop value — and ranks them. This is
the fastest, clearest way to ask *"what's the best value for this one knob?"*
*"Sweep the fast EMA from 5 to 15 and the stop from $200 to $600."*
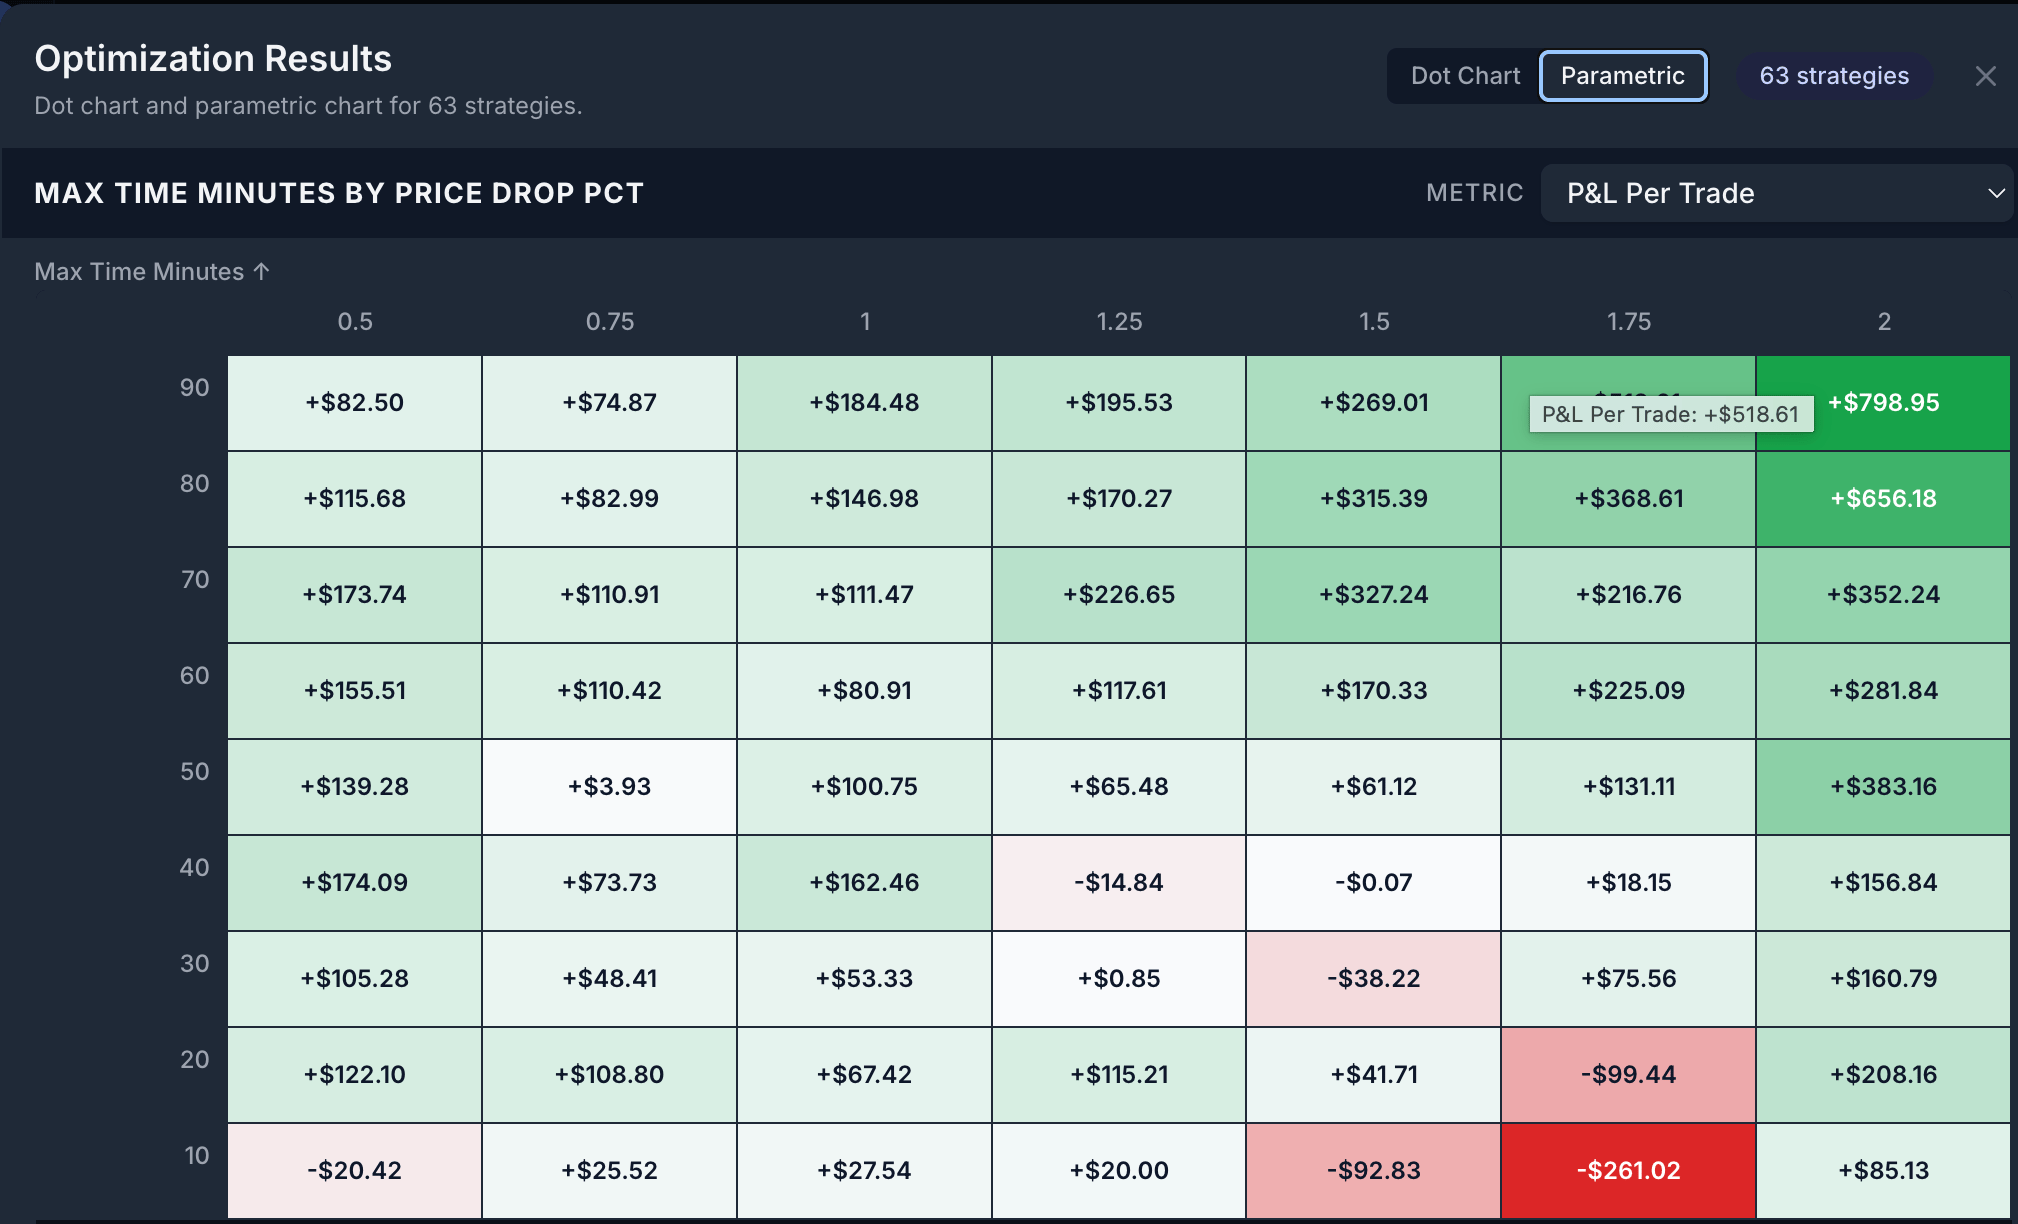
AskFutures runs the full grid (every fast-EMA value crossed with every stop
value). The **Parametric** heatmap makes it easy to see whether a whole region
performs well or just one lonely cell; switch to the **Dot Chart** to compare
every strategy as individual points.
Want a big sweep without a long wait? Wide ranges on **stops and targets** are
cheap — the engine reuses the indicators and just re-simulates the exits. Wide
ranges on **indicator lengths** (EMA, RSI, ATR windows) are slower because every
value recomputes the indicators. Keep indicator ranges to a handful of values.
See [why some sweeps are faster](/concepts/optimization).
## Reading the scatter and the ranking
Each sweep finishes as a labelled batch — for example *"Optimization 1 ·
Completed · 9 combinations · Best: \$-2.97 avg"* — naming the winning parameters
and their score on your chosen metric.
Each dot is one combination: the parameter value (or pair of values) against
its score. Look for a **broad cluster** of strong results, not a single dot
floating above the rest.
Every combination, sorted by your metric, with the parameter values and the
score for each. The top row is the winner; download the full table as a CSV to
compare every run yourself.
Read the scatter for **shape**, not just the peak. A wide plateau of decent
results is far more trustworthy than one tall spike surrounded by losers.
## Don't overfit
**A sweep finds the parameters that fit the *past* best — which is not the same
as the parameters that will work next.** The more combinations you try, the more
likely the "winner" is just the one that happened to line up with old noise.
Treat the best result as a hypothesis, not a guarantee.
Guard against it:
* Prefer **wide, robust plateaus** over a single razor-thin peak. If only one
exact value works and its neighbours fall apart, that's a red flag.
* Keep sweeps **small and meaningful** — one or two parameters, sensible ranges.
* Re-test the winner on a **different window** (a more recent stretch you didn't
sweep over) before you trust it.
Past performance does not guarantee future results. Always test before you trade.
The full reasoning — peaks vs. plateaus, and how to pick from the robust
region instead of the top row — is in
[overfitting vs. optimization](/concepts/overfitting-vs-optimization).
## Promote the best combination
When you've found a winner you like, ask AskFutures to apply it — *"use the best
stop from that sweep"* or *"apply the winning parameters."* The chosen values
become a **new saved version** of the strategy, with its own freshly-computed
backtest. The version you swept from stays exactly as it was, so you can
[compare them](/guides/version-and-compare) and revert if the optimized version
doesn't hold up out of sample.
## Next steps
## Sweep one parameter or two
*"Sweep the stop from 10 to 50 points in steps of 5."*
AskFutures runs nine backtests — one per stop value — and ranks them. This is
the fastest, clearest way to ask *"what's the best value for this one knob?"*
*"Sweep the fast EMA from 5 to 15 and the stop from $200 to $600."*
AskFutures runs the full grid (every fast-EMA value crossed with every stop
value). The **Parametric** heatmap makes it easy to see whether a whole region
performs well or just one lonely cell; switch to the **Dot Chart** to compare
every strategy as individual points.
Want a big sweep without a long wait? Wide ranges on **stops and targets** are
cheap — the engine reuses the indicators and just re-simulates the exits. Wide
ranges on **indicator lengths** (EMA, RSI, ATR windows) are slower because every
value recomputes the indicators. Keep indicator ranges to a handful of values.
See [why some sweeps are faster](/concepts/optimization).
## Reading the scatter and the ranking
Each sweep finishes as a labelled batch — for example *"Optimization 1 ·
Completed · 9 combinations · Best: \$-2.97 avg"* — naming the winning parameters
and their score on your chosen metric.
Each dot is one combination: the parameter value (or pair of values) against
its score. Look for a **broad cluster** of strong results, not a single dot
floating above the rest.
Every combination, sorted by your metric, with the parameter values and the
score for each. The top row is the winner; download the full table as a CSV to
compare every run yourself.
Read the scatter for **shape**, not just the peak. A wide plateau of decent
results is far more trustworthy than one tall spike surrounded by losers.
## Don't overfit
**A sweep finds the parameters that fit the *past* best — which is not the same
as the parameters that will work next.** The more combinations you try, the more
likely the "winner" is just the one that happened to line up with old noise.
Treat the best result as a hypothesis, not a guarantee.
Guard against it:
* Prefer **wide, robust plateaus** over a single razor-thin peak. If only one
exact value works and its neighbours fall apart, that's a red flag.
* Keep sweeps **small and meaningful** — one or two parameters, sensible ranges.
* Re-test the winner on a **different window** (a more recent stretch you didn't
sweep over) before you trust it.
Past performance does not guarantee future results. Always test before you trade.
The full reasoning — peaks vs. plateaus, and how to pick from the robust
region instead of the top row — is in
[overfitting vs. optimization](/concepts/overfitting-vs-optimization).
## Promote the best combination
When you've found a winner you like, ask AskFutures to apply it — *"use the best
stop from that sweep"* or *"apply the winning parameters."* The chosen values
become a **new saved version** of the strategy, with its own freshly-computed
backtest. The version you swept from stays exactly as it was, so you can
[compare them](/guides/version-and-compare) and revert if the optimized version
doesn't hold up out of sample.
## Next steps