> ## Documentation Index
> Fetch the complete documentation index at: https://docs.askfutures.com/llms.txt
> Use this file to discover all available pages before exploring further.
# Run and read a backtest
> Say "backtest it," then read every result — equity curve, headline and extended metrics, the sample trade chart, and P&L attribution.
Once a strategy exists, testing it is one sentence: **"backtest it."** AskFutures
replays your exact rules over real historical prices and fills the strategy card
with results. This guide walks through triggering a run, then reading every chart
and number it produces — and what "good" versus "concerning" tends to look like.
The AI only translated your idea into rules. The backtest itself is fixed,
deterministic code — real [TA-Lib](https://ta-lib.org/) indicators plus a
numerical simulator. Same rules + same data = the same numbers, every time. See
[Is the backtest real?](/concepts/is-the-backtest-real)
## Trigger a backtest
You need a built strategy first — describe an idea and let AskFutures build
it. See [Build a strategy](/guides/build-a-strategy).
Just ask in chat — *"backtest it"* — or click **Run backtest** on the
strategy card. You don't run anything yourself.
Say it the way you'd say it out loud — *"backtest the last 2 years,"* *"test
it since 2020,"* *"year to date."* No window? AskFutures defaults to the
**last 1 year**. Either way, the result records the exact start and end dates
it used. See [Backtesting](/concepts/backtesting).
The card shows **Passed** (ran cleanly, numbers below), **Failed** (a rule
couldn't be simulated — the card says why; fix it in chat and re-run), or
**Not tested** (hasn't run yet).
 ## The equity curve
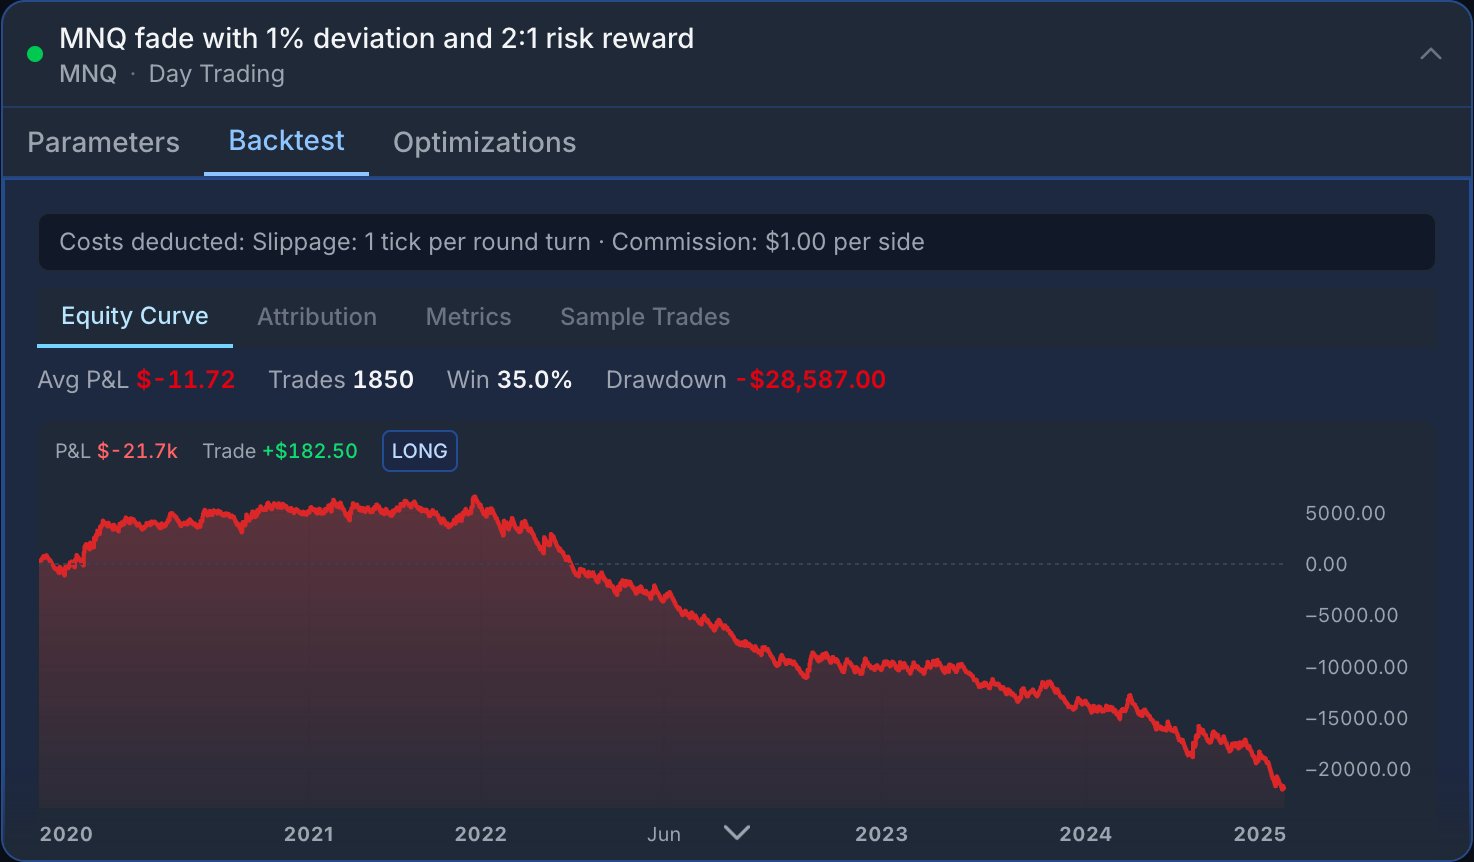
The chart at the top is your **equity curve** — cumulative P\&L over the test
window, trade by trade. It's the fastest read on the whole strategy: where it
made money, where it gave it back, and how smooth the ride was.
What to look for:
* **Up and to the right, steadily.** A line that climbs without giant cliffs is
the healthy shape. Steady beats spiky.
* **One trade or one week carrying everything.** If a single vertical jump is
doing all the work, the edge may not be real or repeatable.
* **Long flat or sliding stretches.** These are the periods you'd have had to sit
through. Map the worst slide to **Max Drawdown** below.
Hover the curve to see the trade at each point. A curve that only goes up
because of two outsized winners is very different from one built on many small
ones, even if the final P\&L matches.
## Headline metrics
Right under the curve are the five numbers that summarize the run. Read them
together — no single one tells the story.
How many trades the rules generated. **Concerning:** very low (a handful —
too few to trust) or very high (over-trading, where costs eat the edge).
Net profit or loss across all trades, after modeled slippage and commission.
The bottom line — but never read it alone.
Total P\&L divided by trade count — your per-trade edge. **Concerning:** a few
ticks either side of zero usually means there's no real edge once costs are
paid.
Share of trades that closed profitable. **Watch out:** a high win rate alone
doesn't mean profitable — many small wins and a few large losses still lose.
The largest peak-to-trough drop in cumulative P\&L — the worst stretch you'd
have sat through. This is your pain-tolerance check, not an afterthought.
Sanity-check Total P\&L against Max Drawdown. Making $5,000 while enduring a
$4,000 drawdown is a very different strategy from making $5,000 with a $800
worst stretch — even though the headline profit is identical.
## Extended metrics
Ask for more — *"show me the extended metrics"* — and AskFutures surfaces the
deeper breakdown. This is where you find out *how* the strategy made (or lost)
its money.
## The equity curve
The chart at the top is your **equity curve** — cumulative P\&L over the test
window, trade by trade. It's the fastest read on the whole strategy: where it
made money, where it gave it back, and how smooth the ride was.
What to look for:
* **Up and to the right, steadily.** A line that climbs without giant cliffs is
the healthy shape. Steady beats spiky.
* **One trade or one week carrying everything.** If a single vertical jump is
doing all the work, the edge may not be real or repeatable.
* **Long flat or sliding stretches.** These are the periods you'd have had to sit
through. Map the worst slide to **Max Drawdown** below.
Hover the curve to see the trade at each point. A curve that only goes up
because of two outsized winners is very different from one built on many small
ones, even if the final P\&L matches.
## Headline metrics
Right under the curve are the five numbers that summarize the run. Read them
together — no single one tells the story.
How many trades the rules generated. **Concerning:** very low (a handful —
too few to trust) or very high (over-trading, where costs eat the edge).
Net profit or loss across all trades, after modeled slippage and commission.
The bottom line — but never read it alone.
Total P\&L divided by trade count — your per-trade edge. **Concerning:** a few
ticks either side of zero usually means there's no real edge once costs are
paid.
Share of trades that closed profitable. **Watch out:** a high win rate alone
doesn't mean profitable — many small wins and a few large losses still lose.
The largest peak-to-trough drop in cumulative P\&L — the worst stretch you'd
have sat through. This is your pain-tolerance check, not an afterthought.
Sanity-check Total P\&L against Max Drawdown. Making $5,000 while enduring a
$4,000 drawdown is a very different strategy from making $5,000 with a $800
worst stretch — even though the headline profit is identical.
## Extended metrics
Ask for more — *"show me the extended metrics"* — and AskFutures surfaces the
deeper breakdown. This is where you find out *how* the strategy made (or lost)
its money.
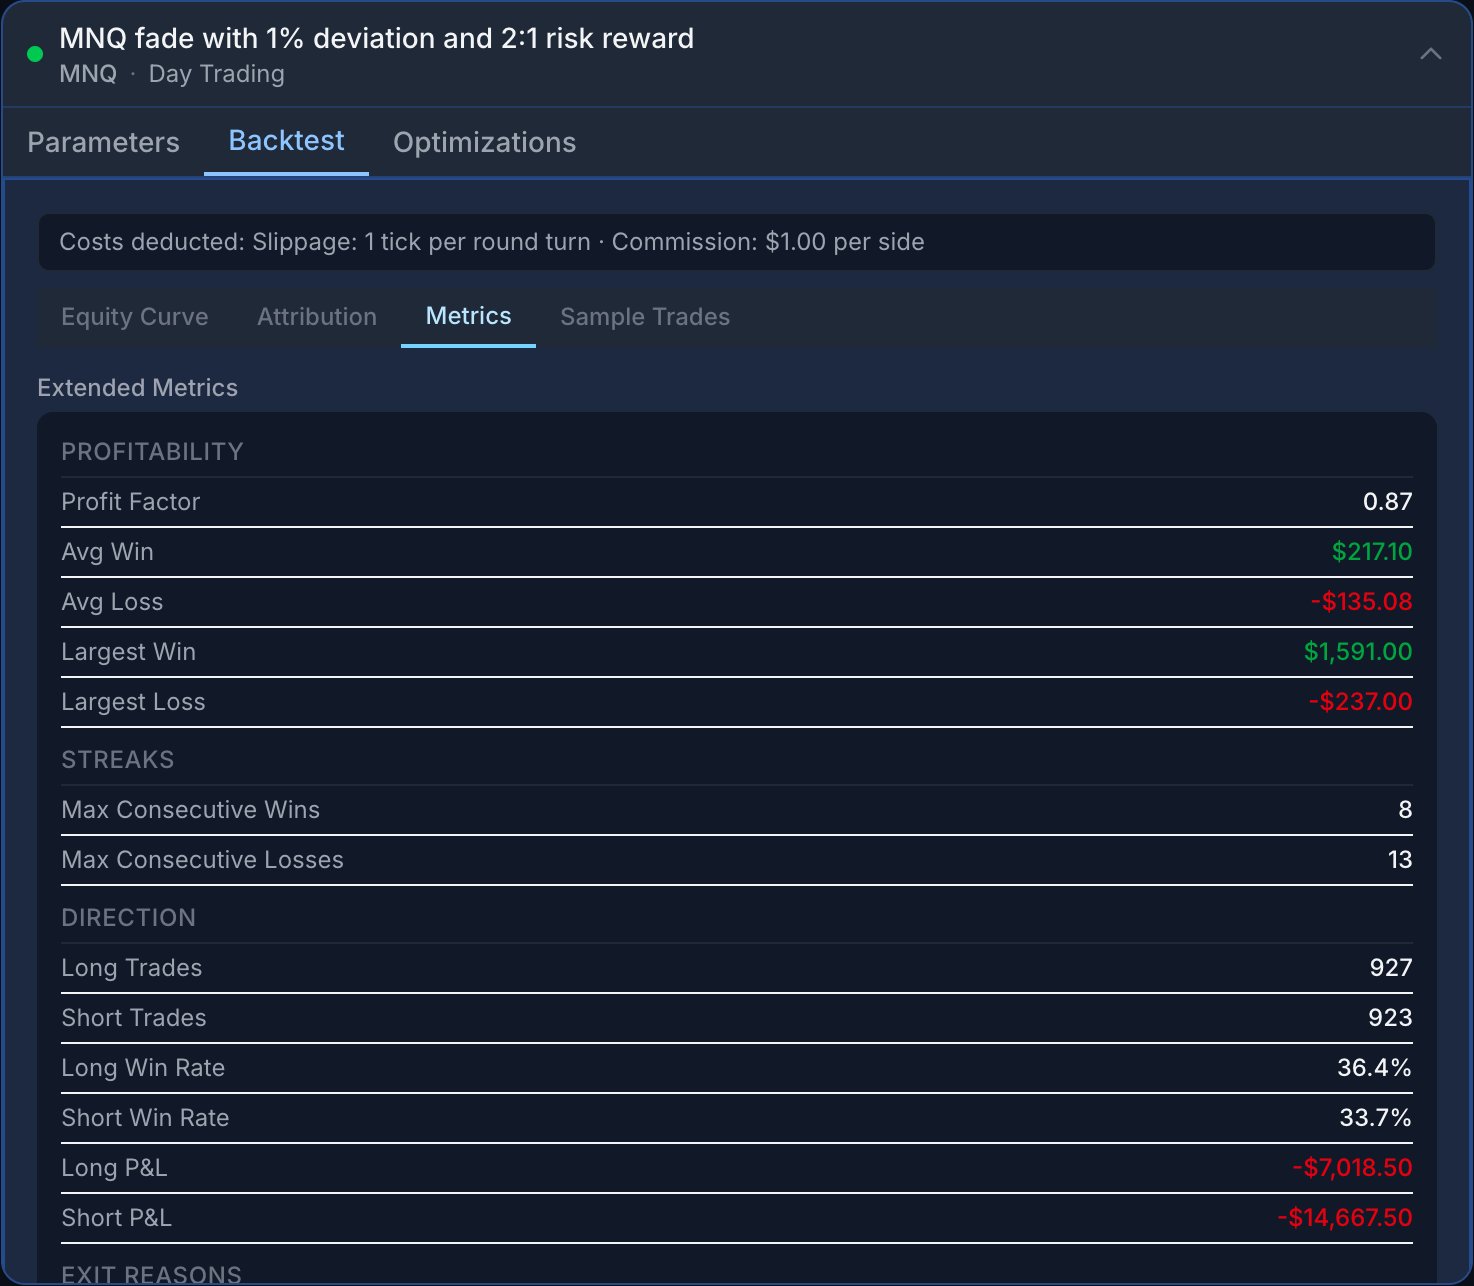 Gross profit divided by gross loss. Above **1.0** means the wins outweigh the
losses; the further above 1.0, the more cushion. A factor right around 1.0 is
a coin flip once you account for real-world frictions the simulator doesn't
capture.
The typical winning trade against the typical loser. Pair this with win rate:
a low win rate can still be very profitable if winners dwarf losers (a trend
strategy), and a high win rate can still bleed if a few losers are huge.
Performance broken out by direction. **Concerning:** if all the profit comes
from longs and the shorts lose, you may really have a long-only edge wearing
a two-sided costume. Consider restricting direction — *"make it long-only."*
How long the average trade stayed open. Check it matches your intent — a
"day-trading" idea showing multi-day holds (or a swing idea closing in
minutes) means a rule isn't doing what you thought.
How often trades left via each exit: `stop`, `target`, `trailing_stop`,
`time`, `session_close`, or `signal`. If almost everything exits on
`session_close`, your stop and target may be too wide to ever trigger; if
`stop` dominates, they may be too tight. This is the fastest way to see
whether your [risk rules](/concepts/risk-and-trade-management) are actually
shaping trades.
## The sample trade chart
AskFutures can show a representative trade plotted on price — entry, exit, and
the levels that mattered (stop, target, the indicator that fired). It turns the
numbers into a picture you can gut-check.
Gross profit divided by gross loss. Above **1.0** means the wins outweigh the
losses; the further above 1.0, the more cushion. A factor right around 1.0 is
a coin flip once you account for real-world frictions the simulator doesn't
capture.
The typical winning trade against the typical loser. Pair this with win rate:
a low win rate can still be very profitable if winners dwarf losers (a trend
strategy), and a high win rate can still bleed if a few losers are huge.
Performance broken out by direction. **Concerning:** if all the profit comes
from longs and the shorts lose, you may really have a long-only edge wearing
a two-sided costume. Consider restricting direction — *"make it long-only."*
How long the average trade stayed open. Check it matches your intent — a
"day-trading" idea showing multi-day holds (or a swing idea closing in
minutes) means a rule isn't doing what you thought.
How often trades left via each exit: `stop`, `target`, `trailing_stop`,
`time`, `session_close`, or `signal`. If almost everything exits on
`session_close`, your stop and target may be too wide to ever trigger; if
`stop` dominates, they may be too tight. This is the fastest way to see
whether your [risk rules](/concepts/risk-and-trade-management) are actually
shaping trades.
## The sample trade chart
AskFutures can show a representative trade plotted on price — entry, exit, and
the levels that mattered (stop, target, the indicator that fired). It turns the
numbers into a picture you can gut-check.
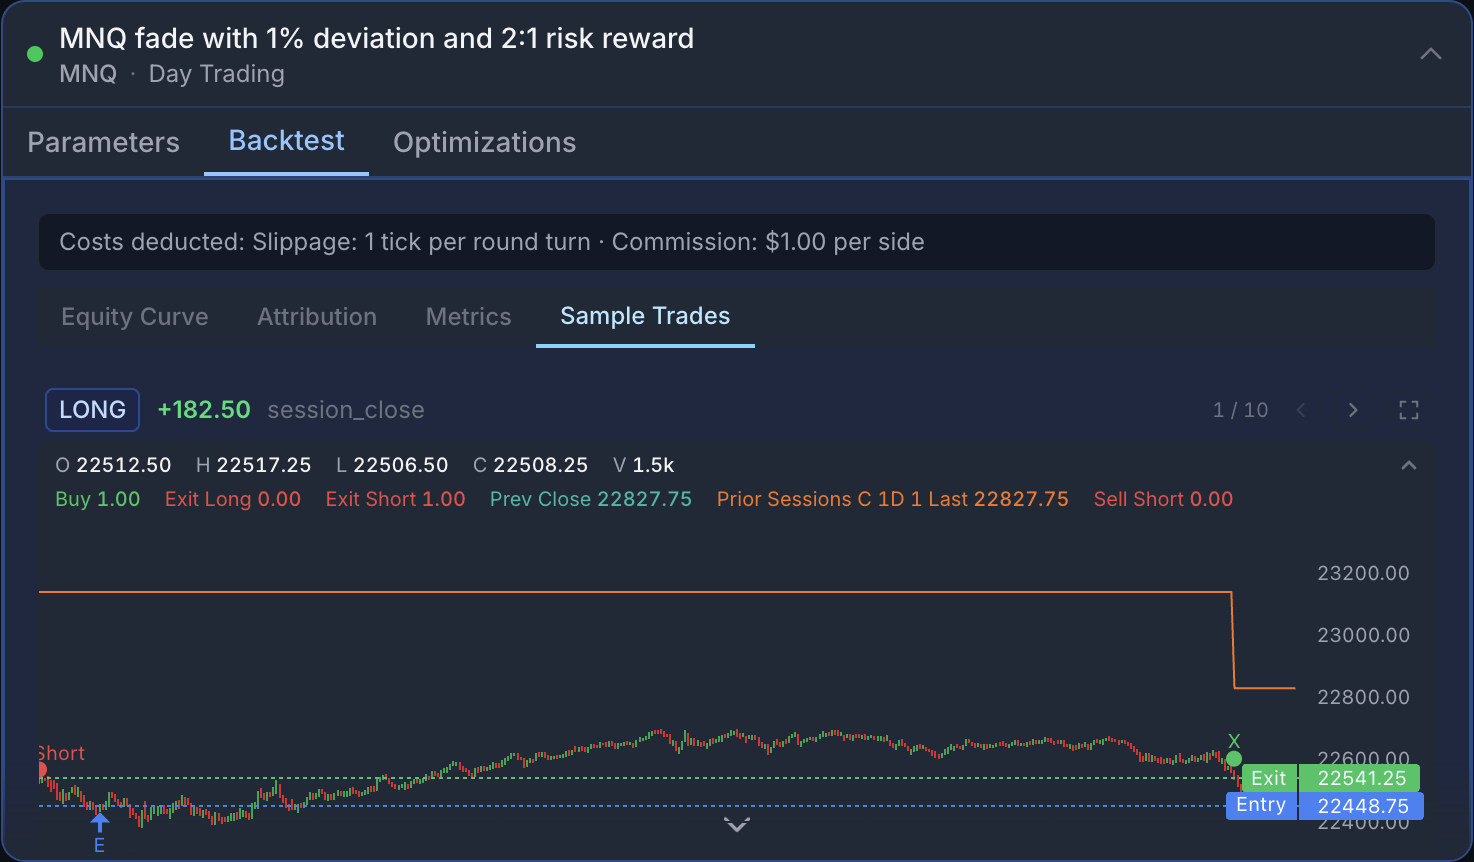 Use it to confirm the strategy is doing what you described: Did entries fire
where you'd expect? Did exits land on the stop, the target, or the bell? If the
picture doesn't match your idea, the rules need a tweak — say what's off in chat.
## P\&L attribution
Attribution answers *"where did the money actually come from?"* — sliced by
direction, by exit reason, and across time. It's how you tell a robust edge from
a lucky one.
* **By direction** — longs vs. shorts (see the split above). Lopsided profit is a
flag.
* **By exit reason** — are targets carrying the strategy, or is it just dodging
losers with stops? Profit that lives entirely in `target` exits is fragile if
the target is finely tuned.
* **Across time** — does it earn consistently, or did one quarter make the year?
The equity curve is the visual version of this.
Want the raw detail? Download the full trade list (and the per-bar signal data)
from the strategy card and audit it yourself. Because the engine is
deterministic, the export always reconciles to the headline metrics. See
[Backtesting](/concepts/backtesting#exportable-artifacts).
## "Good" vs. "concerning" at a glance
A high-level read — not rules, just patterns worth a second look.
| Looks healthy | Worth a closer look |
| ---------------------------------------- | -------------------------------------- |
| Smooth, rising equity curve | Profit from one or two outsized trades |
| Enough trades to trust the sample | A handful of trades, or thousands |
| Avg P\&L comfortably above costs | Avg P\&L hovering near zero |
| Profit factor meaningfully above 1.0 | Profit factor near 1.0 |
| Profit on both directions (if two-sided) | All profit from one direction |
| Drawdown you could actually sit through | Drawdown larger than the total profit |
| Exits spread across stop/target/signal | Everything exits on session close |
Backtest results are **hypothetical and simulated** — no real trades were
placed. Simulated results are designed with the benefit of hindsight and can
under- or over-state live outcomes (real liquidity, slippage, and execution
delays differ). **Past performance does not guarantee future results. Always
test before you trade.**
## Next steps
Don't like a number? Change one rule and re-run.
Sweep the tunable numbers to find better settings.
Exact definitions of every metric above.
Why these numbers are reproducible — and what they don't model.
Use it to confirm the strategy is doing what you described: Did entries fire
where you'd expect? Did exits land on the stop, the target, or the bell? If the
picture doesn't match your idea, the rules need a tweak — say what's off in chat.
## P\&L attribution
Attribution answers *"where did the money actually come from?"* — sliced by
direction, by exit reason, and across time. It's how you tell a robust edge from
a lucky one.
* **By direction** — longs vs. shorts (see the split above). Lopsided profit is a
flag.
* **By exit reason** — are targets carrying the strategy, or is it just dodging
losers with stops? Profit that lives entirely in `target` exits is fragile if
the target is finely tuned.
* **Across time** — does it earn consistently, or did one quarter make the year?
The equity curve is the visual version of this.
Want the raw detail? Download the full trade list (and the per-bar signal data)
from the strategy card and audit it yourself. Because the engine is
deterministic, the export always reconciles to the headline metrics. See
[Backtesting](/concepts/backtesting#exportable-artifacts).
## "Good" vs. "concerning" at a glance
A high-level read — not rules, just patterns worth a second look.
| Looks healthy | Worth a closer look |
| ---------------------------------------- | -------------------------------------- |
| Smooth, rising equity curve | Profit from one or two outsized trades |
| Enough trades to trust the sample | A handful of trades, or thousands |
| Avg P\&L comfortably above costs | Avg P\&L hovering near zero |
| Profit factor meaningfully above 1.0 | Profit factor near 1.0 |
| Profit on both directions (if two-sided) | All profit from one direction |
| Drawdown you could actually sit through | Drawdown larger than the total profit |
| Exits spread across stop/target/signal | Everything exits on session close |
Backtest results are **hypothetical and simulated** — no real trades were
placed. Simulated results are designed with the benefit of hindsight and can
under- or over-state live outcomes (real liquidity, slippage, and execution
delays differ). **Past performance does not guarantee future results. Always
test before you trade.**
## Next steps
Don't like a number? Change one rule and re-run.
Sweep the tunable numbers to find better settings.
Exact definitions of every metric above.
Why these numbers are reproducible — and what they don't model.